XAG/USD: Murrey analysis 12 February 2019, 13:43
XAG/USD: Murrey analysis
12 February 2019, 13:43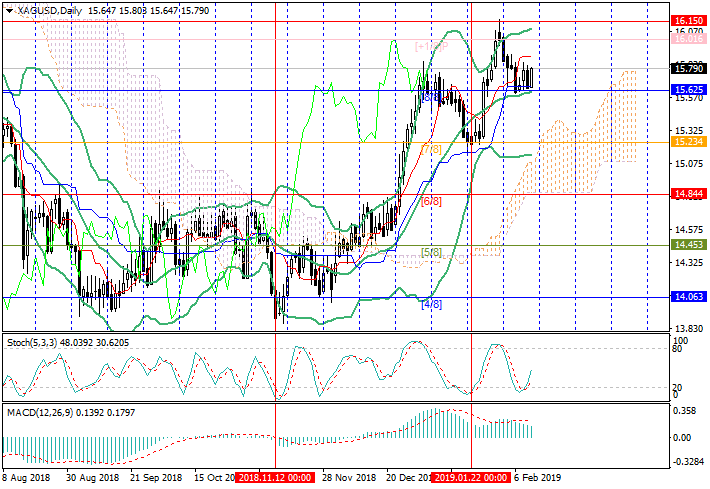
| Scenario | |
|---|---|
| Timeframe | Weekly |
| Recommendation | BUY STOP |
| Entry Point | 15.83 |
| Take Profit | 16.00, 16.15 |
| Stop Loss | 15.68 |
| Key Levels | 15.23, 15.43, 15.62, 16.00, 16.15, 16.40 |
| Alternative scenario | |
|---|---|
| Recommendation | SELL STOP |
| Entry Point | 15.55 |
| Take Profit | 15.43, 15.23 |
| Stop Loss | 15.62 |
| Key Levels | 15.23, 15.43, 15.62, 16.00, 16.15, 16.40 |
On the daily chart, the price reversed around 16.00 ([+1/8]) and dropped to
15.62 ([8/8], the middle line of Bollinger bands), trying to get back into the
framework of the Murrey trading range.
Currently, a short-term increase to 16.00 ([+1/8]) and 16.15 (January highs) is possible, as Stochastic has moved out of the oversold zone. However, in the medium term, a downward correction seems quite likely, which is indicated by the divergence of the price chart and MACD histogram. If the price consolidates below the strong support level of 15.62, the “bearish” targets will be 15.43 ([–2/8], H4) and 15.23 ([7/8], the bottom line of Bollinger bands).
Support and resistance
Resistance levels: 16.00, 16.15, 16.40.
Support levels: 15.62, 15.43, 15.23.

Trading tips
Long positions can be opened from the level of 15.83 with the targets at 16.00, 16.15 and stop loss around 15.68.
Short positions can be opened from the level of 15.55 with the targets at 15.43, 15.23 and stop loss around 15.62.
Implementation period: 4–5 days.
Currently, a short-term increase to 16.00 ([+1/8]) and 16.15 (January highs) is possible, as Stochastic has moved out of the oversold zone. However, in the medium term, a downward correction seems quite likely, which is indicated by the divergence of the price chart and MACD histogram. If the price consolidates below the strong support level of 15.62, the “bearish” targets will be 15.43 ([–2/8], H4) and 15.23 ([7/8], the bottom line of Bollinger bands).
Support and resistance
Resistance levels: 16.00, 16.15, 16.40.
Support levels: 15.62, 15.43, 15.23.
Trading tips
Long positions can be opened from the level of 15.83 with the targets at 16.00, 16.15 and stop loss around 15.68.
Short positions can be opened from the level of 15.55 with the targets at 15.43, 15.23 and stop loss around 15.62.
Implementation period: 4–5 days.


Post a Comment