Bitcoin: technical analysis
Bitcoin: technical analysis

| Scenario | |
|---|---|
| Timeframe | Weekly |
| Recommendation | BUY STOP |
| Entry Point | 5370.00 |
| Take Profit | 5625.00 |
| Stop Loss | 5170.00 |
| Key Levels | 4375.00, 4687.50, 5000.00, 5312.50, 5625.00 |
| Alternative scenario | |
|---|---|
| Recommendation | SELL STOP |
| Entry Point | 4940.00 |
| Take Profit | 4687.50, 4375.00 |
| Stop Loss | 5150.00 |
| Key Levels | 4375.00, 4687.50, 5000.00, 5312.50, 5625.00 |
Current trend
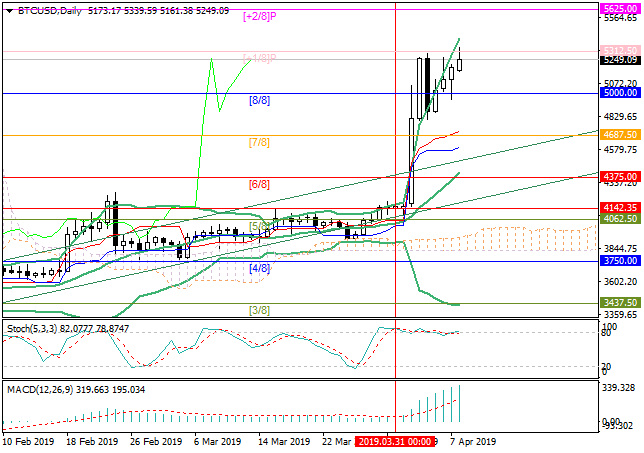
Last week, the price of Bitcoin rose aggressively and reached annual maxima near 5300.00. After the technical correction on Thursday, the price began to grow again and today tested the level of 5312.50 (Murrey [+1/8]) and may continue growing to 5625.00 (Murrey [+2/8]). This is evidenced by a serious divergence of Bollinger Bands and the growth of MACD histogram in the positive zone. However, it is worth considering that, despite the growth potential, the beginning of a new downward correction is quite possible, which is confirmed by Stochastic in the overbought zone and the price chart leaving the main Murrey trading range. The level of 5000.00 (Murrey [0/8]) seems to be the key for the "bears". Its breakdown will give the prospect of a decline to 4687.50 (Murrey [7/8]) and 4375.00 (Murrey [6/8], the midline of Bollinger Bands).
Support and resistance
Support levels: 5312.50, 5625.00.
Resistance levels: 5000.00, 4687.50, 4375.00.

Trading tips
Long positions may be opened above 5312.50 with the target at 5625.00 and stop loss at 5170.00.
Short positions may be opened below 5000.00 with targets at 4687.50, 4375.00 and stop loss at 5150.00.
Implementation period: 4-5 days.
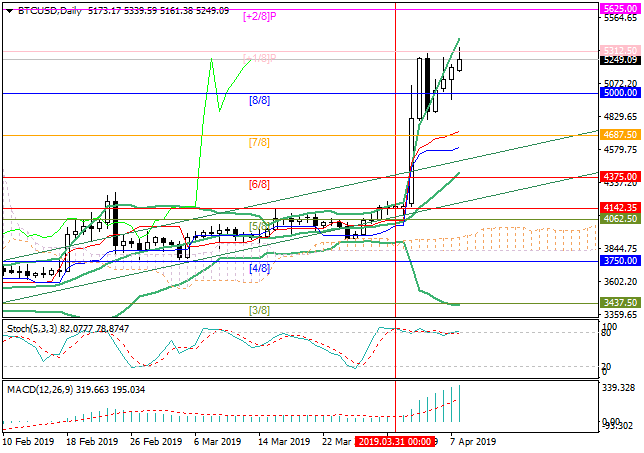
Last week, the price of Bitcoin rose aggressively and reached annual maxima near 5300.00. After the technical correction on Thursday, the price began to grow again and today tested the level of 5312.50 (Murrey [+1/8]) and may continue growing to 5625.00 (Murrey [+2/8]). This is evidenced by a serious divergence of Bollinger Bands and the growth of MACD histogram in the positive zone. However, it is worth considering that, despite the growth potential, the beginning of a new downward correction is quite possible, which is confirmed by Stochastic in the overbought zone and the price chart leaving the main Murrey trading range. The level of 5000.00 (Murrey [0/8]) seems to be the key for the "bears". Its breakdown will give the prospect of a decline to 4687.50 (Murrey [7/8]) and 4375.00 (Murrey [6/8], the midline of Bollinger Bands).
Support and resistance
Support levels: 5312.50, 5625.00.
Resistance levels: 5000.00, 4687.50, 4375.00.

Trading tips
Long positions may be opened above 5312.50 with the target at 5625.00 and stop loss at 5170.00.
Short positions may be opened below 5000.00 with targets at 4687.50, 4375.00 and stop loss at 5150.00.
Implementation period: 4-5 days.


Post a Comment