FDAX: technical analysis
FDAX: technical analysis

| Scenario | |
|---|---|
| Timeframe | Intraday |
| Recommendation | BUY STOP |
| Entry Point | 12030.0 |
| Take Profit | 12100.0 |
| Stop Loss | 12000.0 |
| Key Levels | 11266.6, 11360.2, 11398.6, 11461.1, 11545.1, 11631.5, 11717.9, 11816.3, 11907.6, 12027.6, 12100.9, 12264.4 |
| Alternative scenario | |
|---|---|
| Recommendation | SELL STOP |
| Entry Point | 11900.0 |
| Take Profit | 11820.0 |
| Stop Loss | 11930.0 |
| Key Levels | 11266.6, 11360.2, 11398.6, 11461.1, 11545.1, 11631.5, 11717.9, 11816.3, 11907.6, 12027.6, 12100.9, 12264.4 |
FDAX, H4
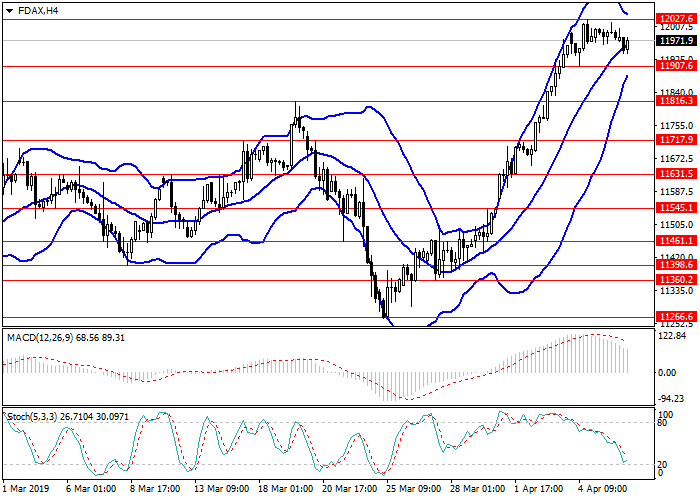
On the H4 chart, the uptrend is still in force, the instrument adjusted to the midline of Bollinger Bands, the price range is narrowed. MACD histogram is in the positive zone and keeps a strong buy signal. Stochastic is moving towards the border with the oversold zone; the oscillator lines are pointing downwards.

FDAX, D1
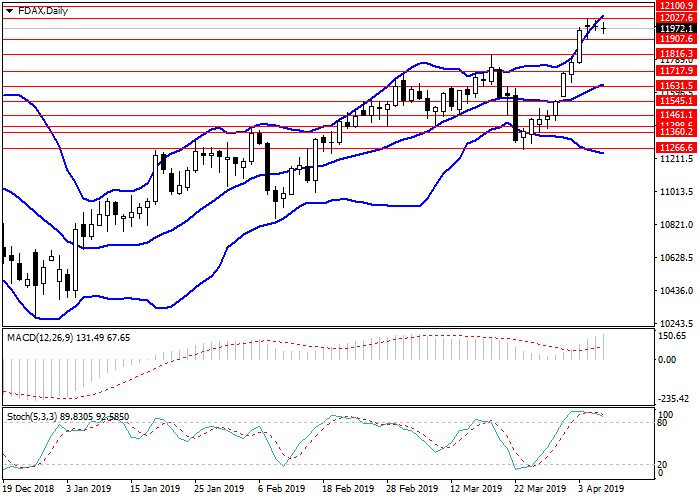
On D1 chart, there is an upward correction, the instrument is traded near the upper border of Bollinger Bands, the price range is expanded, which indicates a possible resumption of growth after correction. MACD histogram is in the positive area keeping a strong signal for the opening of long positions. Stochastic is in the overbought zone, and the lines of the oscillator are directed horizontally.

Key levels
Support levels: 11907.6, 11816.3, 11717.9, 11631.5, 11545.1, 11461.1, 11398.6, 11360.2, 11266.6.
Resistance levels: 12027.6, 12100.9, 12264.4.
Trading tips
According to technical indicators, long positions could be opened from the level of 12030.0 with the target at 12100.0 and stop loss at 12000.0.
Short positions may be opened from 11900.0 with the target at 11820.0 and stop loss at11930.0.
Implementation period: 1-3 days.
On the H4 chart, the uptrend is still in force, the instrument adjusted to the midline of Bollinger Bands, the price range is narrowed. MACD histogram is in the positive zone and keeps a strong buy signal. Stochastic is moving towards the border with the oversold zone; the oscillator lines are pointing downwards.

FDAX, D1
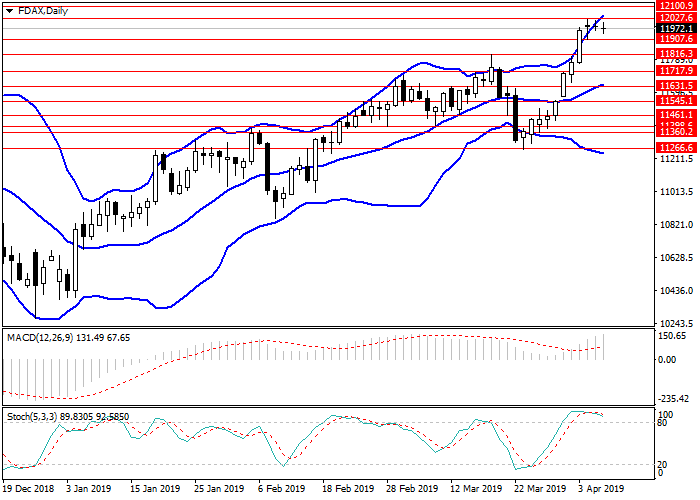
On D1 chart, there is an upward correction, the instrument is traded near the upper border of Bollinger Bands, the price range is expanded, which indicates a possible resumption of growth after correction. MACD histogram is in the positive area keeping a strong signal for the opening of long positions. Stochastic is in the overbought zone, and the lines of the oscillator are directed horizontally.

Key levels
Support levels: 11907.6, 11816.3, 11717.9, 11631.5, 11545.1, 11461.1, 11398.6, 11360.2, 11266.6.
Resistance levels: 12027.6, 12100.9, 12264.4.
Trading tips
According to technical indicators, long positions could be opened from the level of 12030.0 with the target at 12100.0 and stop loss at 12000.0.
Short positions may be opened from 11900.0 with the target at 11820.0 and stop loss at11930.0.
Implementation period: 1-3 days.


Post a Comment