Ethereum: technical analysis
Ethereum: technical analysis
22 January 2019, 12:32
| Scenario | |
|---|---|
| Timeframe | Weekly |
| Recommendation | SELL STOP |
| Entry Point | 114.00 |
| Take Profit | 100.00 |
| Stop Loss | 120.00 |
| Key Levels | 87.50, 100.00, 112.50, 130.00, 137.50, 150.00 |
| Alternative scenario | |
|---|---|
| Recommendation | BUY STOP |
| Entry Point | 132.00 |
| Take Profit | 137.50, 150.00 |
| Stop Loss | 124.00 |
| Key Levels | 87.50, 100.00, 112.50, 130.00, 137.50, 150.00 |
Current trend
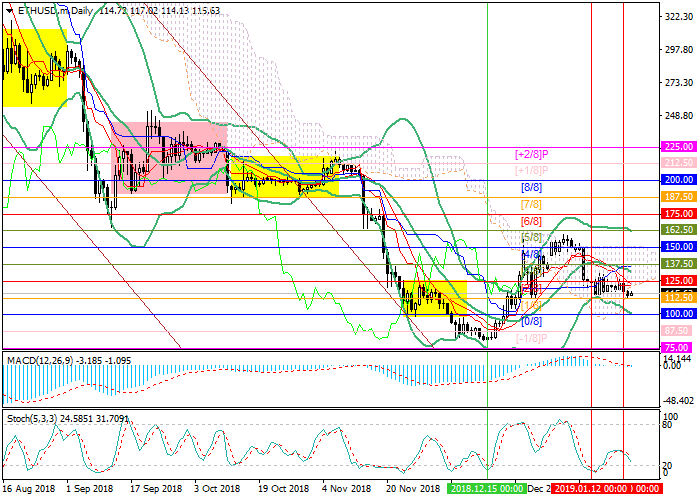
During more than two weeks, the price of Ether has been moving within the sideways channel 130.00–114.00. Currently, the instrument decreased to its lower border, which it cannot yet break. In case of a breakdown and consolidation below the level of 112.50 (Murrey [1/8]), the path to the level of 100.00 (Murrey [0/8]) will open. The probability of decline is confirmed by indicators. The Bollinger bands and Stochastic are reversing downwards. MACD histogram is in the positive zone but its volumes are insignificant.
A breakout of the level of 130.00 may cause an increase to the levels of 137.50 (Murrey [3/8]) and 150.00 (Murrey [4/8]). However, there is no significant driver for the beginning of the strengthening of Ether. On the contrary, another postpone of Constantinople update at the end of February affects the price negatively.
Support and resistance
Resistance levels: 130.00, 137.50, 150.00.
Support levels: 112.50, 100.00, 87.50.
Trading tips
Short positions can be opened after the price is fixed below the level of 112.50 with the target at 100.00 and stop loss around 120.00.
Long positions can be opened after the price is fixed above the level of 130.00 with the targets at 137.50 and 150.00. Stop loss is around 124.00.
Implementation period: 3–5 days.


Post a Comment