Walmart Inc. (WMT/NYSE): general analysis
Walmart Inc. (WMT/NYSE): general analysis
22 January 2019, 13:22
| Scenario | |
|---|---|
| Timeframe | Intraday |
| Recommendation | BUY STOP |
| Entry Point | 98.00 |
| Take Profit | 100.50, 103.00, 105.00 |
| Stop Loss | 97.15, 95.50 |
| Key Levels | 90.00, 93.00, 95.50, 98.00, 100.00, 102.50 |
| Alternative scenario | |
|---|---|
| Recommendation | SELL STOP |
| Entry Point | 95.45 |
| Take Profit | 91.00, 89.00 |
| Stop Loss | 98.00 |
| Key Levels | 90.00, 93.00, 95.50, 98.00, 100.00, 102.50 |
Current trend
Since early January, Walmart Inc. shares gained 4.9% and are currently trading at a monthly high. From the November 6-month maximum, the price decreased by 7.4%. In the second half of February, Q4 report will be published. The company is not expected to have strong results, the decline in earnings per share is projected at 0.75% YoY to 1.32 US dollars.
During the last week, Walmart Inc. rose by 3.05% against the growth of the S&P 500 index by 2.90%.
Support and resistance
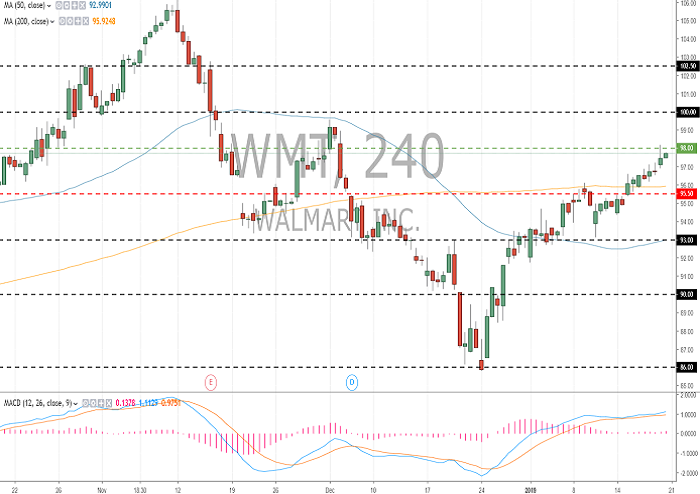
The issuer continues to recover after a long fall. Currently, the price is testing monthly highs. The key resistance level is 98.00. The level of 95.50 is a “mirror” support. There is potential for further growth. Indicators reflect the strength of buyers: the price is fixed above the MA (50) and MA (200); MACD is in the positive zone. It is better to open the positions from the key levels.
Comparative analysis of the multipliers of the company and competing companies indicates the overvaluation of #WMT.
Resistance levels: 98.00, 100.00, 102.50.
Support levels: 95.50, 93.00, 90.00.
Trading tips
Long positions can be opened after the price is set above the level of 98.00. The closing of the profitable positions is possible at the levels of 100.50, 103.00 and 105.00. Stop loss is 95.50.
Short positions can be opened after the price is fixed below the level of 95.50 with the target at 91.00–89.00. Stop loss is 98.00.
Implementation period: 3 days.
Since early January, Walmart Inc. shares gained 4.9% and are currently trading at a monthly high. From the November 6-month maximum, the price decreased by 7.4%. In the second half of February, Q4 report will be published. The company is not expected to have strong results, the decline in earnings per share is projected at 0.75% YoY to 1.32 US dollars.
During the last week, Walmart Inc. rose by 3.05% against the growth of the S&P 500 index by 2.90%.
Support and resistance
The issuer continues to recover after a long fall. Currently, the price is testing monthly highs. The key resistance level is 98.00. The level of 95.50 is a “mirror” support. There is potential for further growth. Indicators reflect the strength of buyers: the price is fixed above the MA (50) and MA (200); MACD is in the positive zone. It is better to open the positions from the key levels.
Comparative analysis of the multipliers of the company and competing companies indicates the overvaluation of #WMT.
Resistance levels: 98.00, 100.00, 102.50.
Support levels: 95.50, 93.00, 90.00.
Trading tips
Long positions can be opened after the price is set above the level of 98.00. The closing of the profitable positions is possible at the levels of 100.50, 103.00 and 105.00. Stop loss is 95.50.
Short positions can be opened after the price is fixed below the level of 95.50 with the target at 91.00–89.00. Stop loss is 98.00.
Implementation period: 3 days.


Post a Comment