NZD/USD: technical analysis
NZD/USD: technical analysis
22 January 2019, 09:59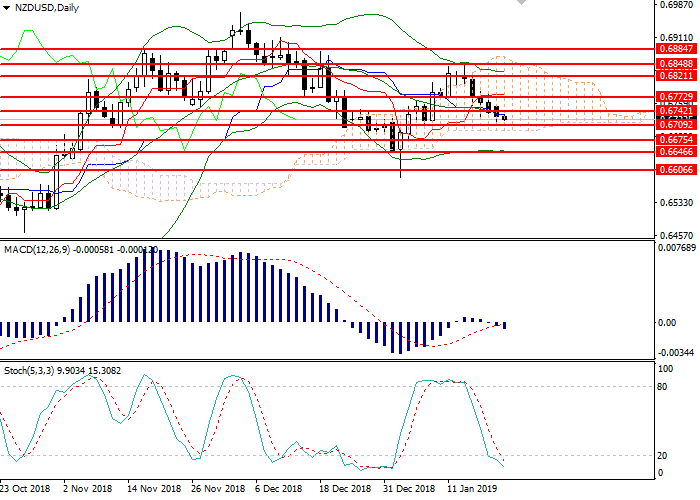
| Scenario | |
|---|---|
| Timeframe | Intraday |
| Recommendation | SELL |
| Entry Point | 0.6713 |
| Take Profit | 0.6645 |
| Stop Loss | 0.6755 |
| Key Levels | 0.6606, 0.6646, 0.6675, 0.6709, 0.6742, 0.6773, 0.6848, 0.6884 |
| Alternative scenario | |
|---|---|
| Recommendation | BUY STOP |
| Entry Point | 0.6760 |
| Take Profit | 0.6810 |
| Stop Loss | 0.6725 |
| Key Levels | 0.6606, 0.6646, 0.6675, 0.6709, 0.6742, 0.6773, 0.6848, 0.6884 |
NZD/USD, D1
On the daily chart, the instrument consolidated below the strong support level of 0.6740. Bollinger bands are directed sideways, and the price range is limited, the continuation of the downward trend looks like the most likely scenario. MACD histogram is being corrected in the neutral zone, the signal to enter the market has not formed. Stochastic entered the oversold area, a signal for opening buy positions can be formed within 1–2 days.

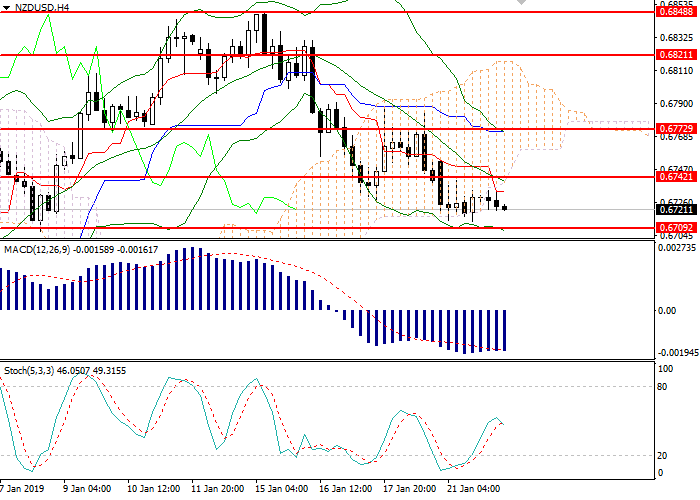
NZD/USD, H4
On the 4-hour chart, the instrument is trading at the bottom of Bollinger bands. Key support is the level of 0.6710. The indicator is directed downwards, and the price range is unchanged, confirming the downward trend. MACD histogram is in the negative zone, keeping a sell signal. Stochastic does not give a signal to enter the market.
Key levels
Resistance levels: 0.6742, 0.6773, 0.6848, 0.6884.
Support levels: 0.6709, 0.6675, 0.6646, 0.6606.
Trading tips
Short positions can be opened from the current level with the target at 0.6645 and stop loss 0.6755. Implementation period: 1–2 days.
Long positions can be opened above the level of 0.6755 with the target at 0.6810 and stop loss 0.6725. Implementation period: 1–3 days.
On the daily chart, the instrument consolidated below the strong support level of 0.6740. Bollinger bands are directed sideways, and the price range is limited, the continuation of the downward trend looks like the most likely scenario. MACD histogram is being corrected in the neutral zone, the signal to enter the market has not formed. Stochastic entered the oversold area, a signal for opening buy positions can be formed within 1–2 days.
NZD/USD, H4
On the 4-hour chart, the instrument is trading at the bottom of Bollinger bands. Key support is the level of 0.6710. The indicator is directed downwards, and the price range is unchanged, confirming the downward trend. MACD histogram is in the negative zone, keeping a sell signal. Stochastic does not give a signal to enter the market.
Key levels
Resistance levels: 0.6742, 0.6773, 0.6848, 0.6884.
Support levels: 0.6709, 0.6675, 0.6646, 0.6606.
Trading tips
Short positions can be opened from the current level with the target at 0.6645 and stop loss 0.6755. Implementation period: 1–2 days.
Long positions can be opened above the level of 0.6755 with the target at 0.6810 and stop loss 0.6725. Implementation period: 1–3 days.


Post a Comment