XAU/USD: gold prices are declining
XAU/USD: gold prices are declining
22 January 2019, 09:44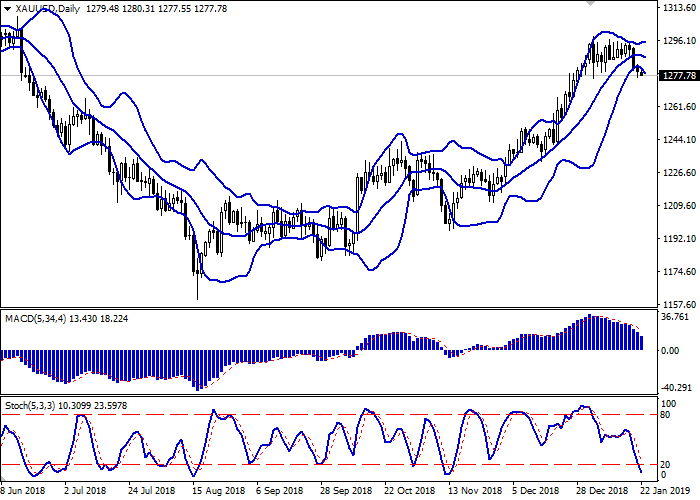
| Scenario | |
|---|---|
| Timeframe | Intraday |
| Recommendation | BUY STOP |
| Entry Point | 1283.30 |
| Take Profit | 1292.69, 1298.32 |
| Stop Loss | 1277.00 |
| Key Levels | 1260.75, 1266.26, 1270.11, 1276.58, 1283.26, 1287.60, 1292.69, 1298.32 |
| Alternative scenario | |
|---|---|
| Recommendation | SELL STOP |
| Entry Point | 1276.50 |
| Take Profit | 1266.26,1283-6 1260.75 |
| Stop Loss | 1283.26 |
| Key Levels | 1260.75, 1266.26, 1270.11, 1276.58, 1283.26, 1287.60, 1292.69, 1298.32 |
Current trend
Gold prices declined on Monday, updating local lows of January 4 and continuing the development of a strong “bearish” impetus formed at the end of last week. However, by the close of the afternoon session the instrument managed to recover most of its losses, which was caused by investor disappointment regarding the Brexit reserve plan, which was presented yesterday by Prime Minister Theresa May.
Additional pressure on the instrument was exerted by quite good macroeconomic indicators from China, which on the whole met the expectations of analysts and contributed to a certain increase in interest in risk in the market.
In turn, gold is still supported by sentiment in the Fed. The heads of the regulator agree that it is necessary to take a pause in the cycle of raising interest rates or at least revise the dates for the next increase. The next Fed meeting will take place on January 29-30.
Support and resistance
On the D1 chart Bollinger Bands are reversing downwards. The price range is expanding, but it fails to catch the development of correctional "bearish" trend at the moment. MACD is declining keeping a stable sell signal (located below the signal line). Stochastic keeps a steady downward direction, but is rapidly approaching its minimum levels, which indicates the risks associated with the oversold gold.
Existing short positions should be kept until the situation clears up.
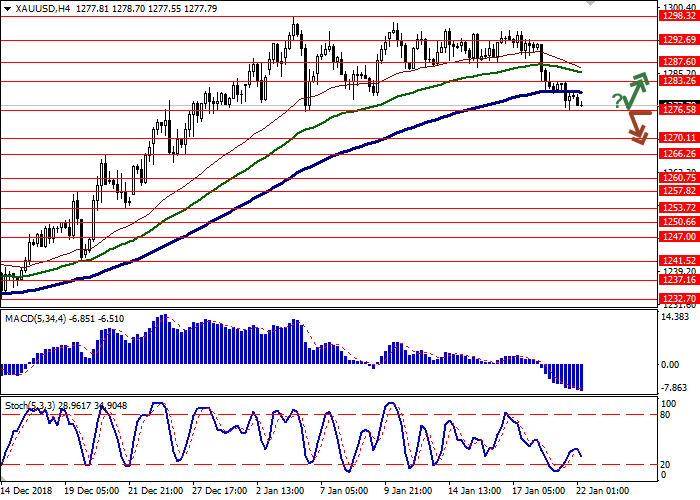
Resistance levels: 1283.26, 1287.60, 1292.69, 1298.32.
Support levels: 1276.58, 1270.11, 1266.26, 1260.75.

Trading tips
To open long positions, one can rely on the rebound from 1276.58 as from support with the subsequent breakout of 1283.26. Take profit — 1292.69 or 1298.32.
A breakdown of 1276.58 may be a signal to further sales with target at 1266.26 or 1260.75. Stop loss — 1283.26.
Implementation time: 2-3 days.
Gold prices declined on Monday, updating local lows of January 4 and continuing the development of a strong “bearish” impetus formed at the end of last week. However, by the close of the afternoon session the instrument managed to recover most of its losses, which was caused by investor disappointment regarding the Brexit reserve plan, which was presented yesterday by Prime Minister Theresa May.
Additional pressure on the instrument was exerted by quite good macroeconomic indicators from China, which on the whole met the expectations of analysts and contributed to a certain increase in interest in risk in the market.
In turn, gold is still supported by sentiment in the Fed. The heads of the regulator agree that it is necessary to take a pause in the cycle of raising interest rates or at least revise the dates for the next increase. The next Fed meeting will take place on January 29-30.
Support and resistance
On the D1 chart Bollinger Bands are reversing downwards. The price range is expanding, but it fails to catch the development of correctional "bearish" trend at the moment. MACD is declining keeping a stable sell signal (located below the signal line). Stochastic keeps a steady downward direction, but is rapidly approaching its minimum levels, which indicates the risks associated with the oversold gold.
Existing short positions should be kept until the situation clears up.
Resistance levels: 1283.26, 1287.60, 1292.69, 1298.32.
Support levels: 1276.58, 1270.11, 1266.26, 1260.75.
Trading tips
To open long positions, one can rely on the rebound from 1276.58 as from support with the subsequent breakout of 1283.26. Take profit — 1292.69 or 1298.32.
A breakdown of 1276.58 may be a signal to further sales with target at 1266.26 or 1260.75. Stop loss — 1283.26.
Implementation time: 2-3 days.


Post a Comment